A Beginner’s Guide to Web Page Optimization
You are not your audience. Five humbling words that explain why so many messages fall flat, emails flop, and web pages fail.
Could you afford to continue investing time in something that wasn’t working? Probably not. That means you need to know how well your digital content is performing. You need to know when performance can be improved. And you need to know how to improve it. Analytics and testing can help you with that.
Web pages: what to measure
What does ‘success’ look like on your page? What about your page actually fuels your organization’s goals? Usually this is an exchange or transaction with your supporter, like a completed action or donation form. That’s your key performance indicator (KPI). Measure performance against that (not some vanity metric like ‘page impressions’).
Get to ‘why’
Just knowing how well a page is performing against its KPI is great if your end-goal is to file a report. But it doesn’t really tell you where to begin to improve performance. A good analytics system shouldn’t just tell you how well a page is performing; it should also give you hints as to why.
Many factors can influence page performance, including:
- Traffic origin (search / email / twitter / facebook organic / facebook ads / magazine ad, etc.)
- Time (day / week / month / year)
- Device (mobile / tablet / desktop)
- Supporter type (cold contact / warm contact / returning donor / monthly donor, etc.)
- Content (page quality & split tests)
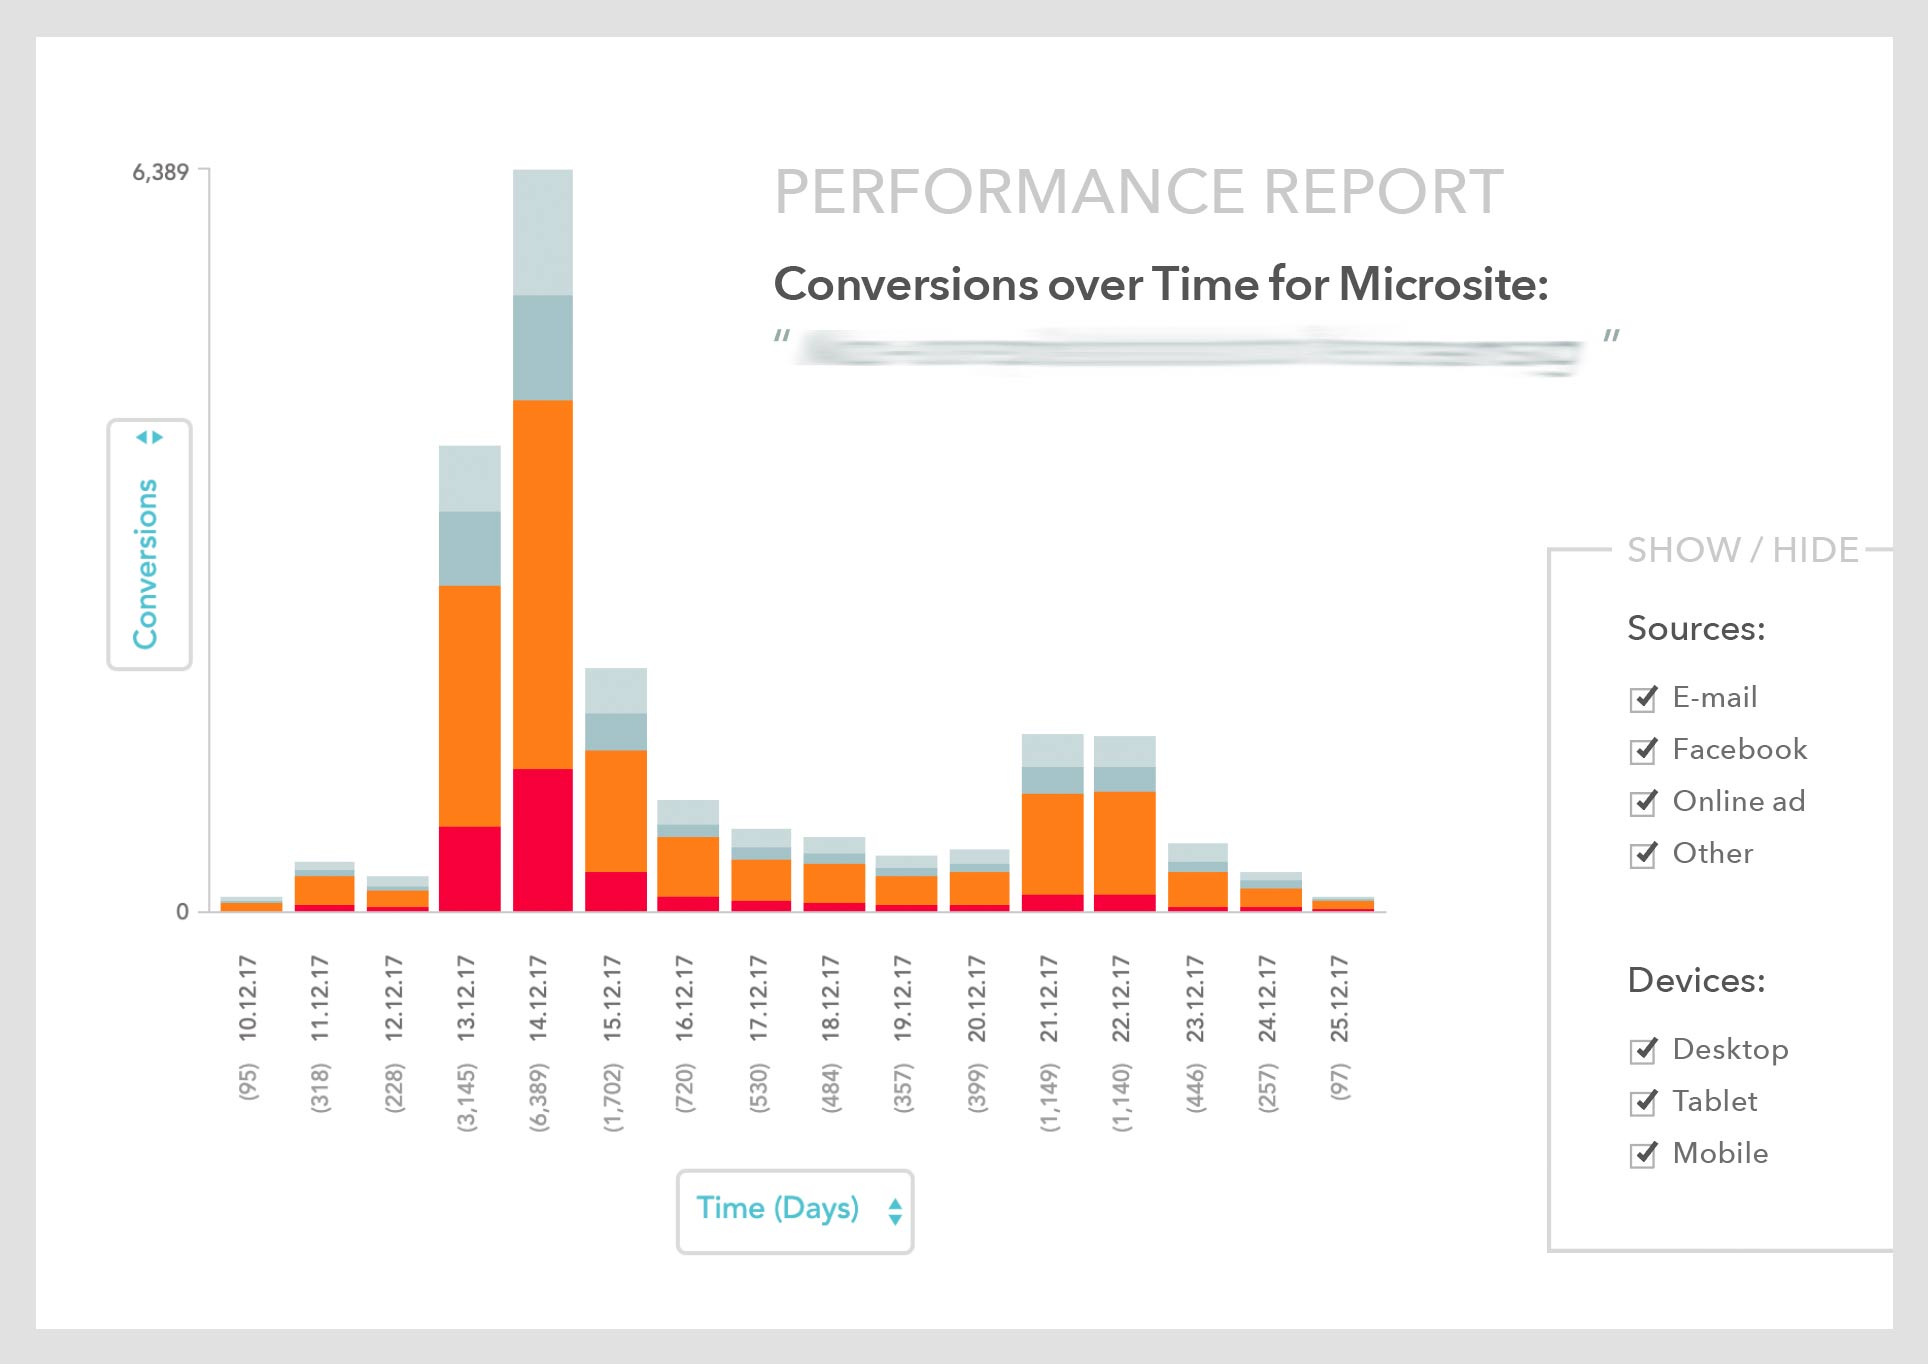
A good analytics system will let you look at performance from multiple angles. This lets you see which factors are influencing the success (or failure) of your page.
For example, on the surface your page performance might be ‘average’. But if you view your analytics from a device perspective, you might discover that conversion rates for desktop are much higher than mobile. That tells you that you have much to gain by optimizing your mobile page layout.
Or, if you split by traffic origin, you may discover that two paid ads are both generating lots of traffic, but only one is converting. That tells you to either drop the underperforming ad, or optimize it by tweaking its audience or content to better suit your landing page.
Multi-dimensional analytics can also reveal cool insights such as...
- Which traffic sources are converting the most cold contacts (and are therefore best for list-building)?
- What day of the week do supporters have the highest attention spans to complete online actions?
- Are supporters more likely to sign up as monthly donors when they are using a desktop device?
- Which traffic sources are bringing in the highest-converting (and therefore most valuable) web traffic?
 A multi-dimensional analytics report
 Keep learning.
Free eBookWeb page analytics tools
- Google Analytics is free, powerful, and easily installed. But it can be overwhelming. Tutorials recommended.
- Paid services like CrazyEgg and HotJar will let you build heat maps, track session behavior, and see exactly where people are clicking and scrolling on your pages.
- Custom systems can fill in any gaps, add unique dimensions to your analytics (such as understanding supporter type behavioral patterns) or simplify reports down to what your team needs most.
From analyze to optimize
Once you know your web page’s baseline performance, you’re ready to start optimizing it. Draw on your analytics insights to identify what to changes might improve performance. Split testing can take the guesswork out of any questions or assumptions you might have. New to split testing? Here’s your guide.
Was this tip useful?


Get a free weekly digital strategy tip:
Unsubscribe any time. We respect your data. View the privacy policy.
Like this tip? Share it!


